Chillers market. Light at the end of the tunnel?
In 2016, the decline in the Russian chiller market continued. In terms of capacity, sales fell by 27%. At the same time, in 2015 the fall compared to the previous year was 17% (Graph 1).
Graph 1. Sales of chillers (in terms of capacity) by the type of compressor in
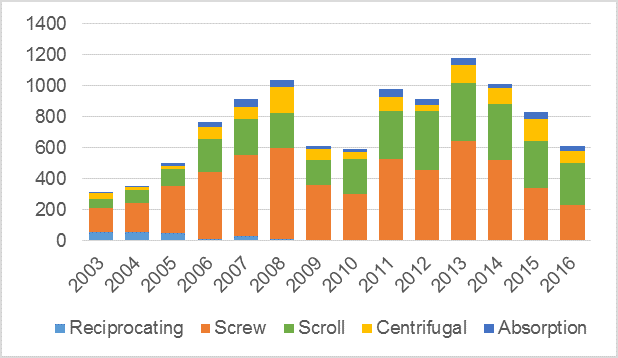
Source: Litvinchuk Marketing
It is noteworthy that there are fundamental changes in the structure of sales of chillers by the type of compressor: market preferences are shifted towards compressors of the scroll type. In 2016, for the first time in history, sales of chillers with the scroll compressors exceeded the sales of cooling machines with the screw-type compressors (in terms of capacity).
The reason is that the capacity range of chillers based on the scroll compressors is expanding. There are already manufactured 1.6 megawatt chillers, such devices are cheaper than the chillers of a similar capacity with the screw compressors.
In the money terms, the decline in sales in 2016 was 24%, in the number of chillers only 13%. That is, there was a decrease in the average capacity of the chiller, while the share of the low-cost devices increased. This could be very clearly seen in the composition of the three market leaders (again, in terms of capacity). In 2016, for the first time the leader in terms of sales in Russia became the brand not included in the ⌠big three■ (Carrier, York, Trane). Moreover, none of these brands was among the three leaders! The leader group was as follows: Rhoss, Clivet and Daikin. After them with a small margin was Trane, and then York and Russian producer Tekhnogrupp whose products are manufactured under the brands NED and Korf.
By the way, the share of Russian products also increased (Graph 2). In terms of capacity, it already has 11.1% of the market, against 7.9% a year earlier. This corresponds to the growth of the total capacity from 65.4 to 67.6 megawatts. For comparison, in 2013, the share of Russian equipment did not exceed 1.7%, and its total capacity ≈ 15.6 megawatts.
Chillers in Russia for a long time are successfully manufactured by such companies as Thermocool, Aerocond and Teplosibmash, but the scale of production for many years did not exceed
Considering the growth in the number and quality of the production sites, as well as the fact that the 90% of low-temperature cooling machines are manufactured in Russia, we can expect a further increase of the share of the Russian manufacturers. The preferences in participation in the public procurement will only accelerate this process.
In 2017, we can expect an increase of the share of the Russian made chillers to 25% in the number terms and to
Such a forecast can be safely done because the state purchases make up at least 15% of the total delivery of equipment and the purchases by the companies with the state participation make up another 40% ≈ 45%. According to the Decree No. 925 of the Government of the Russian Federation of September 25, starting from January 1, 2017, in conducting the state and municipal procurement, Russian products will be recognized the winners of tenders, even if their price is 15% higher than the price of the imported analogs. Considering the fact that now Russian products are approximately
In the next
Graph 2. Russian market of chillers in the capacity terms. Import and domestic production
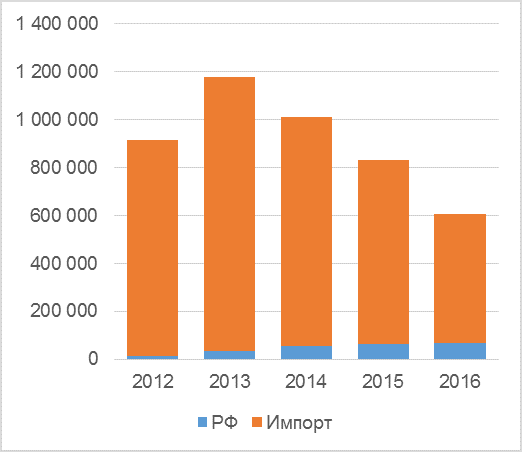
Source: Litvinchuk Marketing
Speaking about the fall in sales in 2016, it is necessary to note one important fact. The dynamics of the market in the last quarter of the year was significantly different from the dynamics of the year in general. Let▓s consider the dynamics of the import of chillers (in the capacity terms) by months in comparison with the similar periods of the previous year (Graph 3). It can be clearly seen that the decline trend of sales shaped at the end of 2014, broke in the autumn of 2016. Of course, it is too risky to make far-reaching conclusions based on the statistics for 3 months only. We have to see if the positive trend goes on in the first quarter of 2017. At the same time, there are factors that support the fact that the market has already passed the bottom. Let▓s see a similar graph for the market of the VRF-systems which compete with the chillers (Graph 4).
Graph 3. Monthly dynamics of the import of chillers (in terms of capacity) in percentage to the same month of the previous year
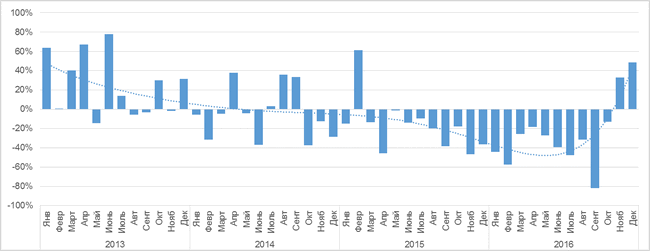
Source: Litvinchuk Marketing
Graph 4. Monthly dynamics of the import of the full-size VRF-systems (in terms of capacity) in percentage to the same month of the previous year
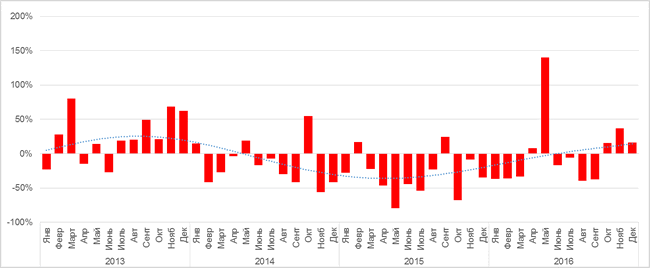
Source: Litvinchuk Marketing
At the Graph 4, it can be clearly seen the stable positive dynamics in the last quarter of 2016. The leap in May was caused, most likely, by the drop of sales in May, 2015. If we consider other markets, then, for example, for the high capacity industrial boilers the dynamics of the last quarter of 2016 to the same period of 2015 is minus 4%, while the year in general demonstrates dynamics of minus 36%. This allows us to hope for a gradual improvement of the situation. Nevertheless, we should not expect a rapid growth in the coming years.
Georgy Litvinchuk,
Marketing Agency Litvinchuk Marketing